mirror of
https://github.com/davrot/pytutorial.git
synced 2025-07-08 17:00:02 +02:00
|
|
||
|---|---|---|
| .. | ||
| image0.png | ||
| image1.png | ||
| README.md | ||
Meshgrid
{:.no_toc}
* TOC {:toc}The goal
Questions to David Rotermund
numpy.meshgrid
numpy.meshgrid(*xi, copy=True, sparse=False, indexing='xy')
Return a list of coordinate matrices from coordinate vectors.
Make N-D coordinate arrays for vectorized evaluations of N-D scalar/vector fields over N-D grids, given one-dimensional coordinate arrays x1, x2,…, xn.
import numpy as np
import matplotlib.pyplot as plt
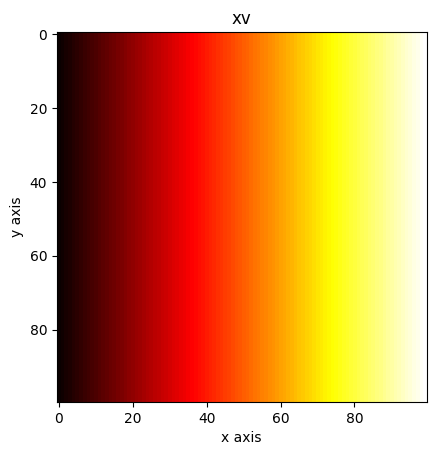
x = np.linspace(0, 1, 100)
y = np.linspace(0, 1, 100)
xv, yv = np.meshgrid(x, y)
plt.imshow(xv, cmap="hot")
plt.xlabel("x axis")
plt.ylabel("y axis")
plt.title("xv")
plt.show()
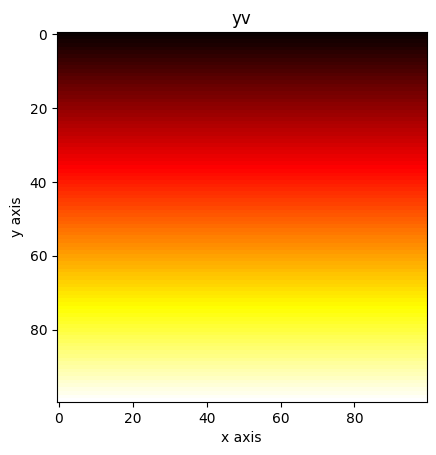
plt.imshow(yv, cmap="hot")
plt.xlabel("x axis")
plt.ylabel("y axis")
plt.title("yv")
plt.show()
An example:
import numpy as np
import matplotlib.pyplot as plt

x = np.linspace(0, 1, 100)
y = np.linspace(0, 1, 100)

xv, yv = np.meshgrid(x, y)

a = np.sin(xv * 2 * np.pi) * np.sin(yv * 8 * np.pi)

plt.imshow(a, cmap="hot")
plt.xlabel("x axis")
plt.ylabel("y axis")
plt.show()

The question is if you really need a mesh or if just using broadcasting can do the job too. I guess this depends on your need.
import numpy as np
import matplotlib.pyplot as plt

x = np.linspace(0, 1, 100)[np.newaxis, :]
y = np.linspace(0, 1, 100)[:, np.newaxis]

a = np.sin(x * 2 * np.pi) * np.sin(y * 8 * np.pi)

plt.imshow(a, cmap="hot")
plt.xlabel("x axis")
plt.ylabel("y axis")
plt.show()
