|
|
||
|---|---|---|
| .. | ||
| image0.png | ||
| README.md | ||
Animation and Slider
{:.no_toc}
* TOC {:toc}The goal
Questions to David Rotermund
Test data
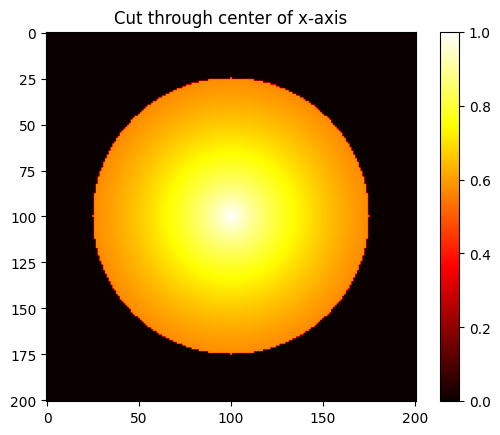
import numpy as np
import matplotlib.pyplot as plt

axis = np.arange(-100, 101) / 100.0

x = axis[:, np.newaxis, np.newaxis].copy()
y = axis[np.newaxis, :, np.newaxis].copy()
z = axis[np.newaxis, np.newaxis, :].copy()

r = np.sqrt(x**2 + y**2 + z**2)

mask_0 = r > 0.75
r = 1.0 / (r + 1.0)
r[mask_0] = 0

plt.imshow(r[100, :, :], cmap="hot")
plt.colorbar()
plt.title("Cut through center of x-axis")
plt.show()
Animation
functools.partial
functools.partial(func, /, *args, **keywords)
Return a new partial object which when called will behave like func called with the positional arguments args and keyword arguments keywords. If more arguments are supplied to the call, they are appended to args. If additional keyword arguments are supplied, they extend and override keywords.
matplotlib.animation.FuncAnimation
class matplotlib.animation.FuncAnimation(fig, func, frames=None, init_func=None, fargs=None, save_count=None, *, cache_frame_data=True, **kwargs)
fig: Figure
The figure object used to get needed events, such as draw or resize.
func: callable
The function to call at each frame. The first argument will be the next value in frames. Any additional positional arguments can be supplied using functools.partial or via the fargs parameter.
It is often more convenient to provide the arguments using functools.partial. In this way it is also possible to pass keyword arguments. To pass a function with both positional and keyword arguments, set all arguments as keyword arguments, just leaving the frame argument unset:
def func(frame, art, *, y=None):
    ...

ani = FuncAnimation(fig, partial(func, art=ln, y='foo'))
frames : iterable, int, generator function, or None, optional
Source of data to pass func and each frame of the animation
If an iterable, then simply use the values provided. If the iterable has a length, it will override the save_count kwarg.
If an integer, then equivalent to passing range(frames)
If a generator function, then must have the signature:
def gen_function() -> obj
If None, then equivalent to passing itertools.count.
In all of these cases, the values in frames is simply passed through to the user-supplied func and thus can be of any type.
interval : int, default: 200 Delay between frames in milliseconds.
repeat_delay : int, default: 0 The delay in milliseconds between consecutive animation runs, if repeat is True.
repeat : bool, default: True Whether the animation repeats when the sequence of frames is completed.
Example
import numpy as np
import matplotlib.pyplot as plt
import matplotlib.animation
from functools import partial


def next_frame(
    i: int, images: np.ndarray, image_handle: matplotlib.image.AxesImage
) -> None:
    image_handle.set_data(images[i, :, :])
    plt.title(f"Position: {i}")
    return


axis = np.arange(-100, 101) / 100.0

x = axis[:, np.newaxis, np.newaxis].copy()
y = axis[np.newaxis, :, np.newaxis].copy()
z = axis[np.newaxis, np.newaxis, :].copy()

r = np.sqrt(x**2 + y**2 + z**2)

mask_0 = r > 0.75
r = 1.0 / (r + 1.0)
r[mask_0] = 0

number_of_frames: int = r.shape[0]
repeat_movie: bool = False
interval_between_frames_in_ms: int = 100

fig: matplotlib.figure.Figure = plt.figure()
# Generate the initial image
# and set the value range for the whole images array
image_handle = plt.imshow(r[0, :, :], vmin=r.min(), vmax=r.max(), cmap="hot")
plt.colorbar()

animation = matplotlib.animation.FuncAnimation(
    fig,
    partial(next_frame, images=r, image_handle=image_handle),
    frames=number_of_frames,
    interval=interval_between_frames_in_ms,
    repeat=repeat_movie,
)

plt.show()
Save the animation
save(filename[, writer, fps, dpi, codec, ...])
Save the animation as a movie file by drawing every frame.
You need to add the save-method between animation = matplotlib.animation.FuncAnimation(...) and plt.show().
movie_filename: str | None = "movie.mp4"

if movie_filename is not None:
    animation.save(movie_filename)
Please note that you may need the ffmpeg binaries for MP4. The ffmpeg files need to be accessable by Python. i.e. Python needs to know where they are. Under Windows it is helpful to place the three exe files in the binary directory of Python. Under Linux, the distribution package manager should take care of it.
Interactive Python session
There are several options if you don't run it from VS Code interactively. One options is this:
# %%
%matplotlib widget
Another one is this:
# %%
%matplotlib tk
Please check yourself which suits your setup best.
matplotlib.widgets.Slider
class matplotlib.widgets.Slider(ax, label, valmin, valmax, *, valinit=0.5, valfmt=None, closedmin=True, closedmax=True, slidermin=None, slidermax=None, dragging=True, valstep=None, orientation='horizontal', initcolor='r', track_color='lightgrey', handle_style=None, **kwargs)
A slider representing a floating point range.
Create a slider from valmin to valmax in Axes ax. For the slider to remain responsive you must maintain a reference to it. Call on_changed() to connect to the slider event.
ax : Axes
The Axes to put the slider in.
label : str
Slider label.
valmin : float
The minimum value of the slider.
valmax : float
The maximum value of the slider.
valinit : float, default: 0.5 The slider initial position.
valstep : float or array-like, default: None
If a float, the slider will snap to multiples of valstep. If an array the slider will snap to the values in the array.
orientation : {'horizontal', 'vertical'}, default: 'horizontal'
The orientation of the slider.
Example
import numpy as np
import matplotlib.pyplot as plt
import matplotlib
from matplotlib.widgets import Slider
from functools import partial


def next_frame(
    i: int, images: np.ndarray, image_handle: matplotlib.image.AxesImage
) -> None:
    image_handle.set_data(images[i, :, :])
    plt.title(f"Position: {i}")
    return


axis = np.arange(-100, 101) / 100.0

x = axis[:, np.newaxis, np.newaxis].copy()
y = axis[np.newaxis, :, np.newaxis].copy()
z = axis[np.newaxis, np.newaxis, :].copy()

r = np.sqrt(x**2 + y**2 + z**2)

mask_0 = r > 0.75
r = 1.0 / (r + 1.0)
r[mask_0] = 0

number_of_frames: int = r.shape[0]
repeat_movie: bool = False
interval_between_frames_in_ms: int = 100

fig: matplotlib.figure.Figure = plt.figure()
# Generate the initial image
# and set the value range for the whole images array
image_handle = plt.imshow(r[0, :, :], vmin=r.min(), vmax=r.max(), cmap="hot")
plt.colorbar()

axfreq = fig.add_axes([0.4, 0.9, 0.3, 0.03])
slice_slider = Slider(
    ax=axfreq, label="Slice", valmin=0, valmax=r.shape[0] - 1, valinit=0, valstep=1
)

slice_slider.on_changed(partial(next_frame, images=r, image_handle=image_handle))

plt.show()